Unsupervised Classification
Real-world data rarely comes in labeled. However, data tends to naturally cluster around like-things. Consider the following data about stars and galaxies.
In [1]: import pandas as pd

In [2]: data = pd.read_csv("source/downloads/lean_stars_and_galaxies.csv")

In [3]: print(data[:10])
          ra     decl   CLASS      w3  col12
0  342.68700  1.27016  GALAXY   9.203  0.270
1  355.89400  1.26540  GALAXY  10.579  0.021
2    1.97410  1.26642  GALAXY  10.678  0.302
3    3.19715  1.26200  GALAXY   9.662  0.596
4    4.66683  1.26086  GALAXY   9.531  0.406
5    5.40616  1.26758  GALAXY   8.836  0.197
6    6.32845  1.26694  GALAXY  11.931  0.196
7    6.89934  1.26141  GALAXY  10.165  0.169
8    8.19103  1.25947  GALAXY   9.922  0.242
9   16.55700  1.26696  GALAXY   9.561  0.061
If I were to visualize this data, I would see that although there’s a ton of it that might wash out clumpy structure there are still some natural clusters in the data.
In [4]: import matplotlib.pyplot as plt

In [5]: plt.scatter(data.col12, data.w3, s=1, edgecolor="None", c='k', alpha=0.1)
Out[5]: <matplotlib.collections.PathCollection at 0x10c1e0160>

In [6]: plt.xlim(-0.5, 2); plt.ylim(14, 5); plt.minorticks_on()

In [7]: plt.xlabel("Infrared Color"); plt.ylabel("Brightness")
Out[7]: <matplotlib.text.Text at 0x10b717940>
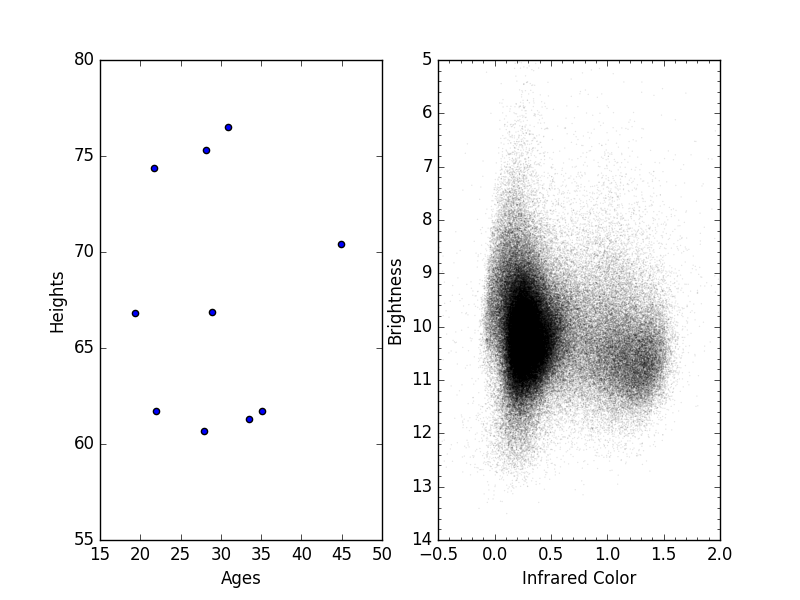
An unsupervised classification algorithm would allow me to pick out these clusters. Although it wouldn’t be able to tell me anything about the data (as it doesn’t know anything aside from the numbers it receives), it would give me a starting point for further study.
With this example my algorithm may decide that a good simple classification boundary is “Infrared Color = 0.6”. This would separate my data into left (IR color < 0.6) and right (IR color > 0.6). From there I can investigate further and study this data to see what might be the cause for this clear separation.
Here are examples of some unsupervised classification algorithms that are used to find clusters in data:
- K-Means Clustering
- Gaussian Mixture Models
- Mean Shift
- Hierarchical Clustering
- Neural Networks